Top Forex Pairs Forex is the largest market in the world and trades around the clock. Which currency pair is trending the strongest RIGHT NOW? Find out what pair is topping our list and where is it going, view this list for free now! Todays Top Performing Forex Pairs
Technical
Analysis written in a straightforward way so that everyone understands.
There's
only a small few who get it consistantly correct and you are certainly
in
that group.
Chris
Thanks
for putting this all together and sharing! BHW
Awesome
Stuff! Kenny has shown time and time again the ability to show us direction in
these markets. Khalsa
Kenny, I appreciate your insight and analysis. You make sense of what I can rarely see.
Thanks for sharing. Gene
Took a gold short at 1240
just closed at 1203 :-)))))))))))))))))) ........ top call!! Gekko
Understanding
Stock Charts
Stock
Market Technical Analysis
Understanding Stock Charts Basics
This section is to help beginners in understanding
stock
charts
analysis. It is an essential part of learning about the stock market
basics and technical analysis fundamentals. If you
already know the basics please take a look at
our
technical analysis tutorial for an
advanced explanation of how
to read stock charts.
We can
often gain
a lot of information from studying a stocks chart so it is
essential to gain an a knowledge of, and learn the basics of understanding how to read stock
charts,
even if you
dont use technical
analysis as part of your main stock picking
strategy.
Understanding Stock Charts -
Basics
Explained
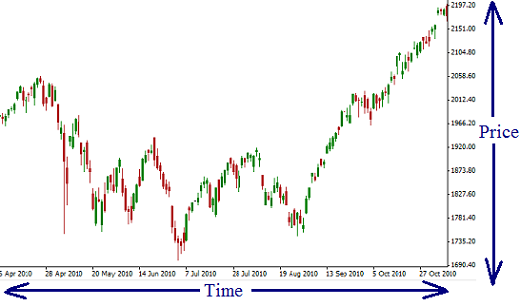
A stock chart
has two axis. The horizontal axis shows time
and the vertical axis shows price.
Horizontal axis - Time
Each charting software package has its own settings but most will allow
you to view a stocks
chart in different time frames. ie
monthly,
weekly, daily. Intraday technical
analysis charts usually have
4hr, 1hr,
30min,15min, 5min and 1min settings and some have more.
In other words, prices on the chart are divided into what ever time
frame you have selected to view it in...eg 1hr segments.
Vertical axis - Price
The chart records the stocks price information for each time
segment you
have chosen and the different types of charts all
show this in
different ways with varying degrees of detail.
Each Stock, commodity, stock
index etc has a symbol called a ticker. This is used by the
Stock
Excanges to identify each instrument. You enter these symbols or
tickers into your charting softwares to display the chart for that
particular market.
A Free
10 part stock market beginners trading course. This trading course
offers an introduction to understanding how the financial markets work
and how to trade successfully.
What is spread betting (spread
trading)
and how does it work? Learn about the many advantages of
financial spread betting and find out where you can spread bet.
Learn how Elliott Wave analysis can improve your trading. Find out how
to access a Free 10 part tutorial for learning about the basics of
Elliott Wave analysis.