How to read stock charts -
Candlestick
Graphs and Charts
Japanese Candlestick charts or graphs,
show the
changes
in price for each
time segment for the setting you are viewing but give a
reader a bit more information than a simple line chart.
Click in the box at the bottom right of our interactive AVAFX chart
below, and
select Candlestick
to see an example of a candlestick graph-chart.
This chart is set on Hourly
so
for a candle-stick-chart that means that every 1 hour a candle will
register on
the chart and this will show the opening, high, low and closing prices
that the stock has been traded at for that particular hour.
The value of the next candle will then fluctuate as the price moves
until
the end of the next
hour, at which point the next candle is sealed, and so on.
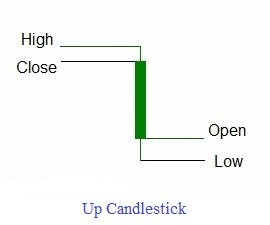
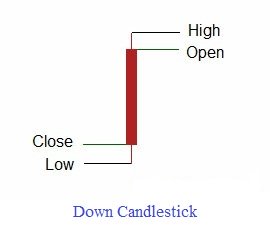
The following charts are examples of an up candlestick
and
a down
candlesick
and each show the price range that market has traded at for that
particular time segment.
Up
candlestick - where the
market has
risen and the closing price is higher than the opening price
Down
candlestick - Where the market has
fallen and
the closing price is below the opening price
So these charts are very useful for short, and long term technical
analysis stock
trading, or to
back up another form of stock picking. As you can see, the same as with
the bar charts, these
charts give us far more information than the basic line charts.
You can see the exact values for each candlstick on the chart below, by
hovering
your cursor above any of the candlesticks that you want to see
the
details for.
This particular chart show live prices courtesy of Avafx
and can be changed to show various different trading
instruments such as stock indexes, commodities and various foreign
currency trading pairs. All you need to do to change it is select from
the range of instruments programmed in to the instrument
box.
Time settings can be adjusted by selecting from the period box
and the charts can be viewed in the different formats by selecting from
the view
box on the bottom right.
Candlestick
Charting Explained
We find that candlestick
graphs-charts
are far easier to read than any of the other types of chart and a lot
more information can be obtained from them and these charts take
technical analysis to another level.
In a similar way to the stock chart patterns analysis, in our
candlestick chart
analysis
there are various
candlestick chart patterns that we can use to identify possible turning
points in a trend, or indeed it could be a continuation candlestick
pattern.
Again, this is a huge area of analysis that we will go into in more
detail in future updates to the site.
A Free
10 part stock market beginners trading course. This trading course
offers an introduction to understanding how the financial markets work
and how to trade successfully.
What is spread betting (spread
trading)
and how does it work? Learn about the many advantages of
financial spread betting and find out where you can spread bet.
Learn how Elliott Wave analysis can improve your trading. Find out how
to access a Free 10 part tutorial for learning about the basics of
Elliott Wave analysis.