Top Forex Pairs Forex is the largest market in the world and trades around the clock. Which currency pair is trending the strongest RIGHT NOW? Find out what pair is topping our list and where is it going, view this list for free now! Todays Top Performing Forex Pairs
Technical
Analysis written in a straightforward way so that everyone understands.
There's
only a small few who get it consistantly correct and you are certainly
in
that group.
Chris
Thanks
for putting this all together and sharing! BHW
Awesome
Stuff! Kenny has shown time and time again the ability to show us direction in
these markets. Khalsa
Kenny, I appreciate your insight and analysis. You make sense of what I can rarely see.
Thanks for sharing. Gene
Took a gold short at 1240
just closed at 1203 :-)))))))))))))))))) ........ top call!! Gekko
Trend
Line Trading Technical Analysis of Stock Trends
Trend
Trading
Trend
Line Trading
This
is part 2 of Trend
Trading and is a continuation from our
trend line trading example
so that
we can try to answer the 'who is buying up here' and 'isnt
technical analysis just hindsight trading' questions.
The initial example trendline
analysis chart
was published here in real time and this
updated chart is also published here real time.
Trading
Trend Lines
In part one
of this technical
analysis of stock trends tutorial, we explained the
trading
strategies we use for entering and exiting trades when
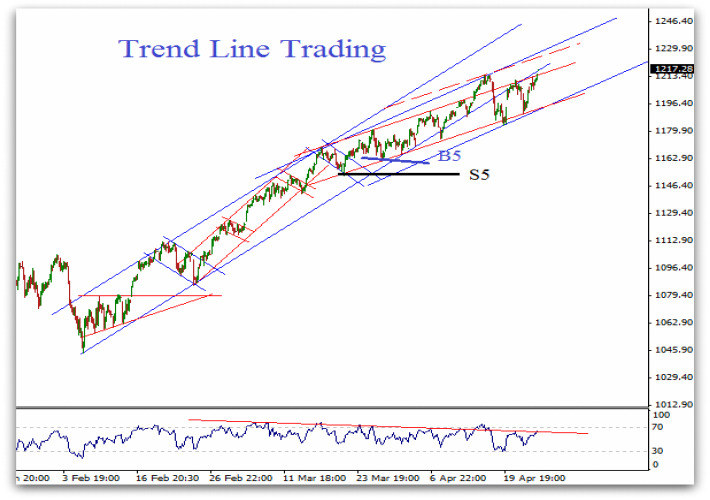
trading using trendline analysis. This the updated chart overview as of
yesterdays
close. We have removed all but the last buy and sell trigger levels to
clean up the chart a bit.
As you can see, trend
traders following this trendlines analysis
strategy would still
currently have 5 long positions (buys) open from where we left off,
since the stop level at S5 has never been breeched.
This is why
trend
line trading works, and can be so profitable. With 5
trades
already well into profit the trader has very little to lose and a huge
amount to gain by adding to their position as the trend develops.Large
institutional traders who have the resources behind them to move
markets by the volumes of buying they are doing, have a vested interest
in keeping this trend going for as long as possible.
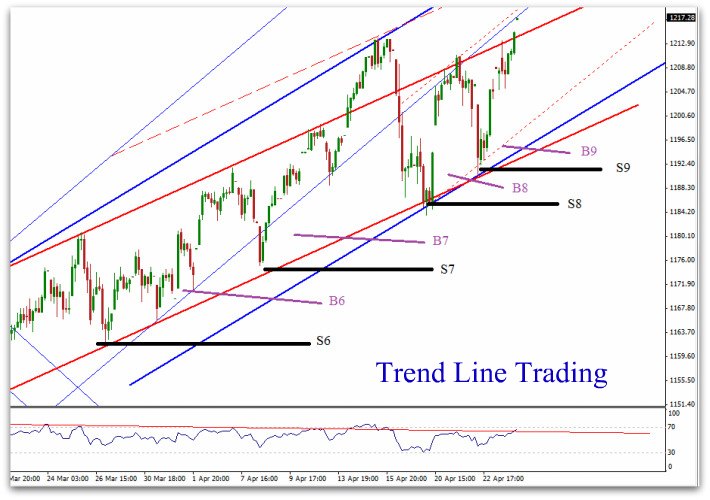
Trend
trading traders and short term traders will continue to
buy each
dip in the market and continue raising their stop levels as they go
(B6-S6, B7-S7 etc).
With a number of profitable positions under your belt, profits are now
increasing at a considerable rate and until prices break
below the lower trend
lines (as a conservative stop), or a sell level
is triggered, there is very little risk involved and much to gain.
Technical Analysis of Stock Trends
Traders tip - The
optimum strategy for any technical analyst is always to let the market
dictate when to enter and exit a trade. If we guess that the trend has
reversed before a sell signal triggers then we run the risk of leaving
a large part of the move on the table, perhaps even the
largest part of the move.
When does it
end
The short answer is - who knows? There is no way to know for sure how
long that trend
will go on for. technical analysts will need to see a
topping pattern (stock chart patterns) for a sign of
weakness, and even then, that needs to be confirmed by a
break of the support levels where we have placed our stops on these
charts.
Tip - Ask any kid with a ruler which direction the chart is going in
and
whether they would buy it or sell it.
Traders
tip -
A topping pattern is a distribution period created when
buyers have backed off or are taking profits, and sellers are entering
the market. This is a consolidation phase where neither buyers or
sellers can gain control of the market.
Technical
Analysis of Stock Trends - Conclusion
So the
question was 'isnt
technical
analysis just hindsight trading'?
I will leave you to answer that one for yourself - you know what I
think and I hope I have explained the logical reasons why trend line
trading works.