Trend Trading
For Maximum Profits
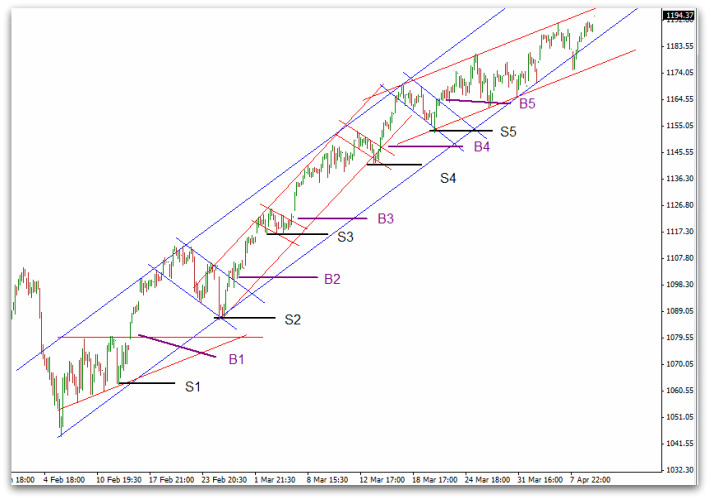
Each time
price breaks out of a
consolidation phase it opens
up a trend
trading opportunity and In this
example the initial buy
trade is taken
when price breaks out of the consolidation pattern at B1, an initial
stop loss order is then placed at S1.
A second trade can be entered at the breakout level B2 and the stop
level on both positions raised to S2 locking in some profit on the
first trade and a small potential loss on the second. This is the point
that trading trends
can become very profitable. Further positions can
be added at B3, B4 and B5
as the trend develops and with very
little risk Each time we add a position we must raise the
stop levels respectively.
A less
aggressive trading
strategy is to only enter and run the initial
one or two trades until they run their course. Stop levels should be
raised in exactly the same way.
Technical Analysis of Stock Trends
|