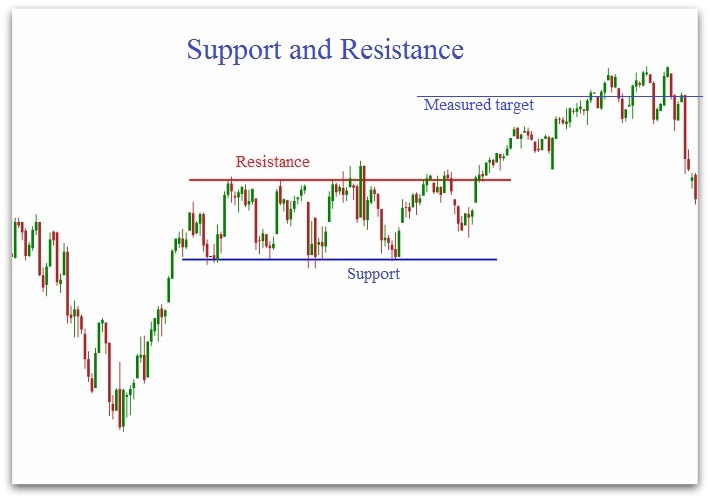
Google +1
Like Page
Like Site
If you like my Site
, please let Google know by clicking the +1
button. If you like this Page,
please click that +1
button, too.
(If you are not logged into your Google account (ex.,
gMail, Docs), a login window opens when you click on +1.
Logging in registers your "vote" with Google. Thank you!)
Note: Not all browsers show
the +1
button.
|
Candlestick Chart Patterns that Make MoneyEssential reference guide. Learn 17 of the most common Japanese candlesticks patterns that consistently make money. Free Candlestick Patterns Guide
|
Technical Analysis
Technical
Analysis
|
Testimonials
Great
site Kenny.
Technical
Analysis written in a straightforward way so that everyone understands.
There's
only a small few who get it consistantly correct and you are certainly
in
that group.
Chris
|
Thanks
for putting this all together and sharing! BHW
|
Awesome
Stuff! Kenny has shown time and time again the ability to show us direction in
these markets. Khalsa
|
Kenny, I appreciate your insight and analysis. You make sense of what I can rarely see.
Thanks for sharing. Gene
|
Took a gold short at 1240
just closed at 1203 :-)))))))))))))))))) ........ top call!! Gekko |
|
|
Trading
Support and Resistance Indicator
Technical
Analysis Fundamentals
What is Trading
Support and
Resistance (S&R)
Technical analysis stock trading is based on the art of finding the trading
support and resistance indicator levels with technical
analysis charts.
- Support
- This is a term used to describe a price level where a
markets prices cant break down through.They may be being held up by the
market for any number of reasons but essentially it is a price level
where the bulls are coming in to buy the market causing prices
to rise back up again.
It may also be the level where sellers are closing short positions
(buying) to take profits and so there is a lack of selling pressure.
- Resistance
- This is where rising prices seem to stick and
just
cant quite break up through a particular price level. Each time it gets
there, the market falls back again. This level may be where a lot of
buyers are taking profits (selling) or where the bears are coming into
sell the market.
Learn how to draw trend
lines for finding trading support
and resistance indicator levels and you will
have
the two
key fundamentals
of understanding financial technical
analysis charts. So what is Support and Resistance trading?
|
Finding
Support and Resistance
Why
does a market find support
at a specific price. This could be for any
number of reasons which we go into in detail in the various pages in
the rest of our technical
analysis charts
section. It could
even be something as simple as a round number.
- Traders and
investors love round numbers. When most folks decide to take a trade
they usually have a number in mind that they want to trade at. For
example, a
trader
may
decide that they will buy when a stock price drops to $20, so when a
stock drops from, say $23.68 there can be a number of traders with the
same idea and are waiting
to enter the market when prices fall back to $20
- $20 is just an example as the same
scenario would have applied at $23,
$22 and $21 on the way down but just at at a lesser degree as more
buyers will have come in at the bigger round numbers. 10s, 100s, 1,000s
and 10,000s etc...you get the drift, right?
The
point is
that support
is created where buyers have gained control.
The strength of that support depends on how much extra buying there is
at
that level.
The
opposite
is true for resistance.
That is where selling has
overwhelmed the buying.

Trading
with Support and Resistance Indicator Trend Lines
|
Trading
Support and Resistance Indicator
Once
the
market has found support
at a particular level, it stands to
reason that if there were enough traders
and investors
buying at that
point in the past then there is a very good possibility that if prices
drop back to that level, they will do so again.
- Day
traders and other short term traders
will then also buy at this level in the belief that prices will rise
again.
-
Those that have already bought may even add to their positions by
buying some more.
- Those that sold where the stock
found
resistance may take profits at previous support.
As you
can
see, there are a number of factors as to why a specific
price may repeatedly provide trading
support or resistance,
the more
instances that prices do find the desired support or resistance at that
point will increase the traders confidence in the value of that price
level encouraging even more trading at that point.

Trading
with Support
and Resistance Indicator Trend Lines
|
Trading
Support and Resistance Patterns
There
are a
number of stock chart patterns that frequently
recur in technical
analysis charts
that a trader can use to try and
gain an understanding to the markets current mood. These patterns are
created when market prices are contained within a trading range for a
period of time. Trading in a range between support and resistance zones
seemingly unable to break beyond, in either direction.
These
patterns often create familiar shapes that can signify to an
analyst which direction prices are likely to eventually break in with
an uncanny degree of regularity. Trading support and resistance
patterns involves trading with the ranges until prices do eventually
make that break.
Traders
need
to be very wary of pre-empting these breaks. Of course it
is always obvious after the fact but that does not help you make money
trading. Trading
support
and resistance lines continue to be support and resistance - until they don't.
In other words, we should expect
a support trend line to continue to provide support until the markets
tell you
otherwise. A technical analyst always lets the market show the way.
Support
becomes Resistance
In a
normal
market, once support or
resistance lines do break, prices
will nearly always come back to test the break. It breaks down through
the support level and prices will return towards the underside of it to
backtest
the trend lines break. You can see in the example charts
above, that the
market broke out through and then returned to test if the break was
real or not.
Conservative
traders will even wait for this backest of the trend lines before
entering a
trade. This type of trade allows you to keep stop loss levels very
tight since a close back into the trading range would
indicate that the break did not have the true support of the markets
and the break was likely to be a panic
move.
|
|