Top Forex PairsForex is the largest market in the world and trades around the clock. Which currency pair is trending the strongest RIGHT NOW? Find out what pair is topping our list and where is it going, view this list for free now! Todays Top Performing Forex Pairs
|
Technical Analysis
Trend
Trading
|
Testimonials
Great
site Kenny.
Technical
Analysis written in a straightforward way so that everyone understands.
There's
only a small few who get it consistantly correct and you are certainly
in
that group.
Chris
|
Thanks
for putting this all together and sharing! BHW
|
Awesome
Stuff! Kenny has shown time and time again the ability to show us direction in
these markets. Khalsa
|
Kenny, I appreciate your insight and analysis. You make sense of what I can rarely see.
Thanks for sharing. Gene
|
Took a gold short at 1240
just closed at 1203 :-)))))))))))))))))) ........ top call!! Gekko |
|
|
Technical
Analysis Of Stock Trends
Trend
Trading - The Numbers
Trend Trading
- Time Frames
The beauty
of Technical
Analysis of stock trends is that it can
be applied to almost any chart
and in any time frame. As with almost all other types technical
analysis, this trend trading strategy can be used at whichever degree
of time frame the analyst trades whether that is for intra day trading
strategies, swing trading or for long term investing.
The
main risk with the longer term time frames is that it is possible that
prices could gap down through our stop levels. This would only really
occur after the market had been closed for the weekend or a holiday.
Price can gap in real time trading
in fast moving financial markets but this is
most likely to be in the direction of the trend that we are
following
anyway.
Either way,
it is essential to protect yourself as
much as possible from these occurrences and if your broker has a
facility to offer guaranteed stops, the marginal extra cost may well be
worth it.
|
Technical
Analysis Of Stock Trends - The Numbers
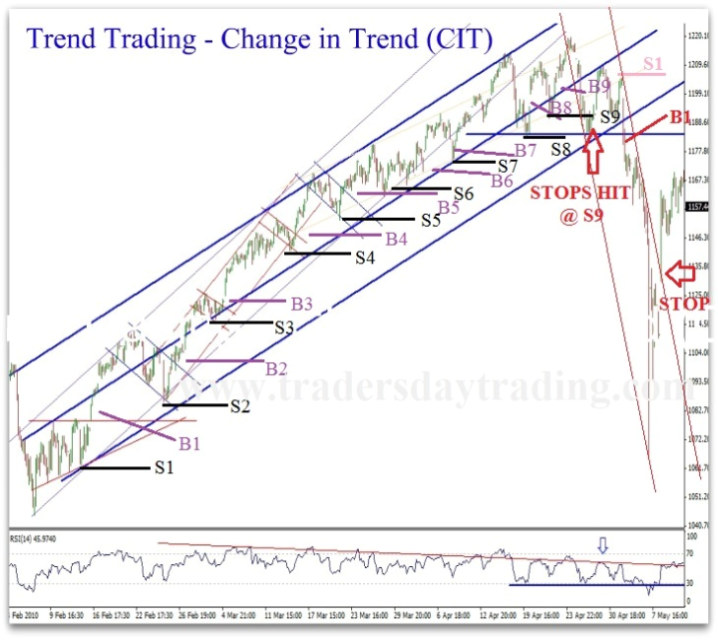
To
conclude this Technical
Analysis of Stock Trends article, and now that
we have a change in trend completing this example of a trend trading
campaign, lets put things into perspective and take a closer look at
the numbers.
For
this example, we will assume a very conservative approach by
calculating using the value for entering a trade only at the break of
the previous highs, rather than the break out from the consolidation
patterns - apart from B8 where it did not quite break, and we have
calculated using the more aggressive entry at the consolidation
breakout.
Our exit
point for all trades is the first of our trailing stop levels to get
hit, in this example it is S9 @ 1190
Trend
Trading Example - Buy / Stop Values
| Trade |
1 |
2 |
3 |
4 |
5 |
6 |
7 |
8 |
9 |
| (B)uy |
1080 |
1100 |
1125 |
1150 |
1170 |
1181 |
1192 |
1200 |
1214 |
| (S)top |
1063 |
1086 |
1116 |
1141 |
1153 |
1164 |
1175 |
1183 |
1190 |
| Risk |
-17 |
-20 |
+43 |
+118 |
+140 |
+178 |
+244 |
+284 |
+308 |
| Overall Gain |
110 |
200 |
265 |
305 |
+325 |
+334 |
+332 |
+322 |
+308 |
Trend Trading - How To Trade Successfully
You
can see from the table that the maximum risk was taken at the initial
phase and even then, this was limited to a maximum loss of 20 sp500
points, even with holding two trades.
There was any number of ways to trade this particular trend example. We
suggested in part1of
this technical analysis of stock trends
article that a conservative trader may only enter and run the
first B1-B2 trades and you will see from the table that would have
netted 110-200 points respectively.
We could have chosen any
combination of these entry points to enter a trade ie B1, B3 and B5 or
another super conservative strategy would have seen B2 as the first
entry point where the market would have broken up and back tested the
break before breaking out upwards again.
Day traders can use
this trend trading
strategy for day trading and may enter a trade at each
or
anyone of these entry points but instead of waiting to get stopped out,
a day trader will take the profits on each short term trade.
The key factor is that which ever entry strategy is used, the trailing
stops strategy must
be implemented as described.
|
|