Top Forex PairsForex is the largest market in the world and trades around the clock. Which currency pair is trending the strongest RIGHT NOW? Find out what pair is topping our list and where is it going, view this list for free now! Todays Top Performing Forex Pairs
|
Technical Analysis
Stock
Chart Patterns
|
Testimonials
Great
site Kenny.
Technical
Analysis written in a straightforward way so that everyone understands.
There's
only a small few who get it consistantly correct and you are certainly
in
that group.
Chris
|
Thanks
for putting this all together and sharing! BHW
|
Awesome
Stuff! Kenny has shown time and time again the ability to show us direction in
these markets. Khalsa
|
Kenny, I appreciate your insight and analysis. You make sense of what I can rarely see.
Thanks for sharing. Gene
|
Took a gold short at 1240
just closed at 1203 :-)))))))))))))))))) ........ top call!! Gekko |
|
|
Double Bottom Pattern
Stock Chart Patterns
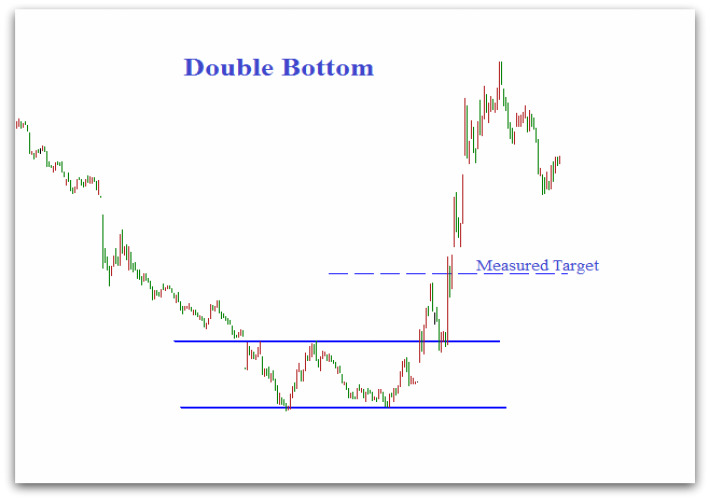
The Double Bottom Pattern
A Double
Bottom pattern (DB) is one of the common stock chart
patterns that are often found in stock market technical analysis
charts. It is a bullish reversal chart pattern that is found at market
bottoms.
The Double Bottom
is one of the most reliable stock chart patterns found in technical
analysis charts. It is a straight forward pattern defined by two clear
lows where the market prices have found a bottom at around the
same price level. A common variation of the Double Bottom is the triple
bottom pattern.
Stock
Chart Patterns Recognition
The first
low is created when the markets prices rise in a consolidation
following a clear trending phase in the market. Prices then fall again
to a around the level of the first bottom
but buyers fail to gain enough momentum to push prices down through the
support. Prices can fall slightly short or slightly exceed the previous
low but as long as it bottoms at around the same price level it is
quite normal. Either way, it should be on lower volume..
As prices rise again buyers gain control and volume increases. The Double Bottom Pattern
is created when prices break up through the level of the previous
consolidation high and this should be broken on high volume.
The
Double Bottom Backtest
In a normal
market, price will usually fall back to backtest the validity of the
break up through resistance. This back test should be on much lower
volume. On rare occasions, it may not do a backtest if the market is
very strong.
Double Bottom
Volume Confirmation
- 2nd low - lower volume
- Subsequent rise - high volume
- Break - high volume
- Backtest - low volume
Double Bottom
Pattern
Double
Bottom Price Targets
A valid Double Bottom
produces a measured move so we can
find a price target by calculating the vertical depth of the
consolidation zone, and
then measuring an equal distance above.
High
Probability Trading Alerts
Service
from the Worlds Leading Market
Forecasting Service. From ETFs and individual stocks to futures, you
get Flash Opportunity
Alerts via email and phone to help you take advantage of the
highest-confidence opportunities in
the most popular markets.
Find out more about EWI's High
Probability
Trading Alerts!
|
Double Bottom
Stop Loss
An Double
Bottom fails
and is not consdidered valid if prices break back below the bottom
before hitting its price target. If prices are accepted back down into
the bottoming zone once it has broken up through resistance, it
is a sign that the chart pattern is severely
weakened and the odds that it is a valid Double Bottom pattern are
reduced.
Triple
Bottom Pattern
The Triple
Bottom pattern is a variation of the Double Bottom chart
Patterns and they come in to play where prices do not break the
level of the previous low, but instead finds further support and
prices rapidly rises back back up through the resistance zone at the
upper end
of the chart pattern. The speed of this move can often find
traders on the wrong side of the markets due to the sharpness of the
turnaround.
This creates a high value trading opportunity as in our experience
there is no such thing as a quadruple bottom, it just does not happen.
Prices must now be seen to move higher quite swiftly. This is a sign
that the buyers have committed themselves and that bears are being
stopped out.
If prices were to fail again they will almost certainly break the low
of the newly formed triple
bottom pattern.
Return from
|
|
|