Standard and Poors 500 Stock Index Head and Shoulders Pattern - Revisited 06May2010
by Kenny
(tradersdaytrading.com)
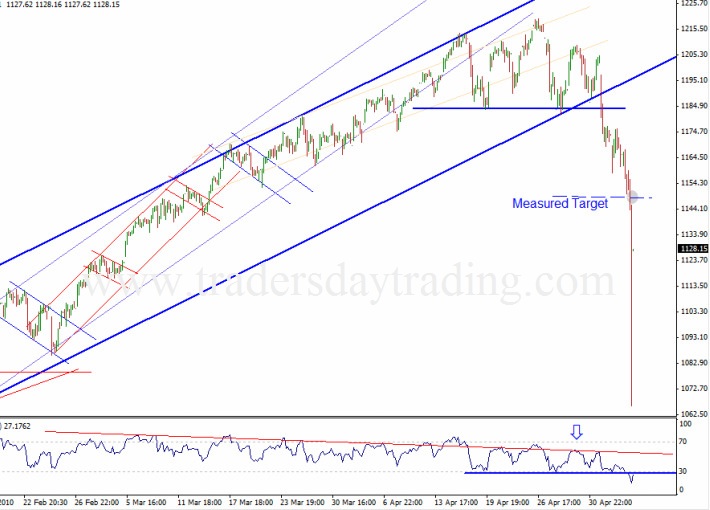
The call in the original Standard and Poors 500 stock index - Head and Shoulders Pattern post was for a sustainable CIT and it now looks like we were spot on with that one.
It is often said that using Technical analysis is like trading in a rear view mirror but I hope we already put that one to bed right here.
Technical analysis is all about finding potentially profitable trade set ups to predict future moves.... and it works just fine.
That does not mean it will always go the 'right' way of course......it is a case of weighing the odds and probabilities...ALWAYS!
Sp500 basically fell off a cliff today and would have triggered a whole lot of stops on longs but as we stated in the Ftse100 H&S analysis posting, despite the kicking the markets took today, we still think this move is going to be part of a larger correction.
We are now completely out of all trades including long term positions. The profits taken today were just too tempting and if we are correct about this move being corrective, then we should be able to get a much better price to re-enter long term short trades.
Back to daytrading for now!
.....................................................................................
This was meant to be a long term analysis section for visitors but until visitor numbers posts pick up, I will hold off with a blog and I will post the stuff here, I quite like this format and I hate speaking to myself :-))
Anyone have views on this format ?
Contact Us
PS - Don't forget to subscribe to our newsletter!
..................................................