Standard and Poors 500 Stock Index
Head and Shoulders Pattern 01May2010
by Kenny
(tradersdaytrading.com)

Standard and Poors 500 - sp500
Folks that know me will know that I consider the Ftse100 as being at the top of the list of the world stock market indexes that take a shot at leading the way.
It would be no surprise at all and in fact, it is very common, for the Ftse100 to top out before the the sp500 and this intermarket divergence can in itself be a very good indicator of a decent CIT (change in trend) coming.
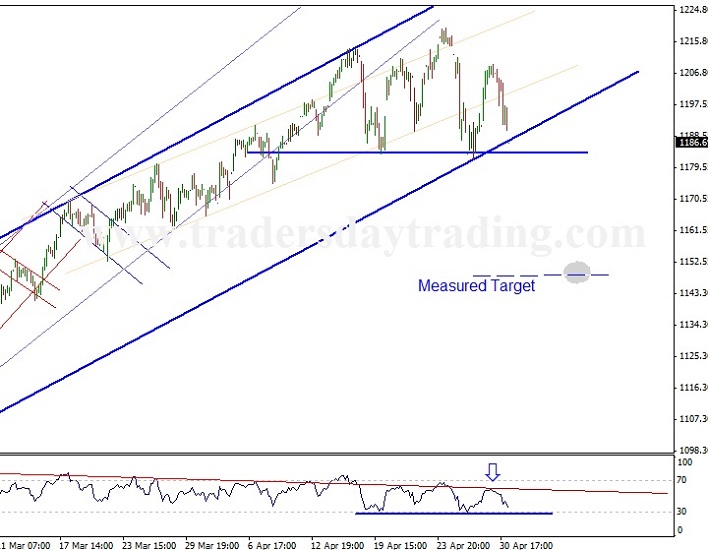
We posted last week that the Ftse100 had broken down from a head and shoulders pattern with a bit of a kick and Standard and Poors 500 Stock Index seems to be following that lead.
Care must be taken as it has not triggered the sell signal yet, by breaking down through the neckline as the Ftse100 chart had, but Technical Analysis is all about odds and probabilities.
Cautious or long term traders and investors should wait for the break and backtest as described in the Ftse scenario. Aggressive and short term traders are likely to already be short.
You may well ask why are we not buying Standard and Poors 500 stock index here as as part of the trend trading strategy?
When considering a trade based on technical analysis charts we always take a number of factors into account and this will be the subject of a future addition to the how to read stock charts section of this website.
Basically, we are at one of these points again where we think there are enough factors suggesting that there is a good possibility of a sustainable CIT (change in trend) from here, but we do need to see it doing what we expect it to do.
If its not happening, we must be ready to bin it.
Standard and Poors 500 Stock Index