SP500 stock index - back testing completion of the head and shoulders! - Updated 01Jun2010
by Kenny
(tradersdaytrading.com)

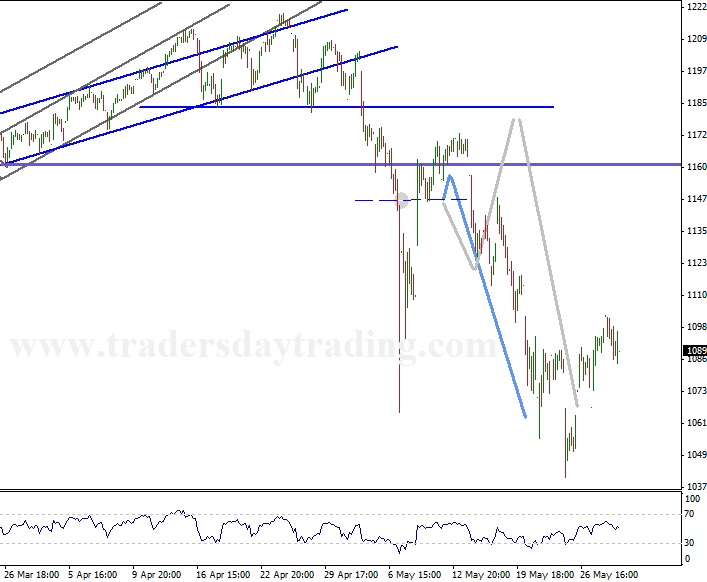
Sp500 technical analysis chart - backtest
SP500 stock index - back testing completion of the head and shoulders! - Updated 01Jun10
From our previous analysis on 10May - Title...SP500 stock index - back testing completion of the head and shoulders!
"Since we are counting this as a corrective bounce via the plan laid out on the Ftse100 speculative chart, we are laying odds that we either near enough completed the back test of the highs and will sort things out soon, or it is possible that we are just competing an 'a' of that backtest."
-----------------------------------------------------------
What we got was the preferred Blue path of the two possibilities that we were looking at, although there was not a lot of difference between them anyway, and both were looking for the same end result.
Going forward from here - the original analysis still holds, in that we think the markets are rolling over for a chunky decline in the medium term but short term analysis is still less clear and another backtest is still possible....but not essential!
We hope you have enjoyed browsing our website. If so, please sign our Guest Book and leave a comment!
Also, please be sure to sign up for our FREE E-zine!
=======================================================================================