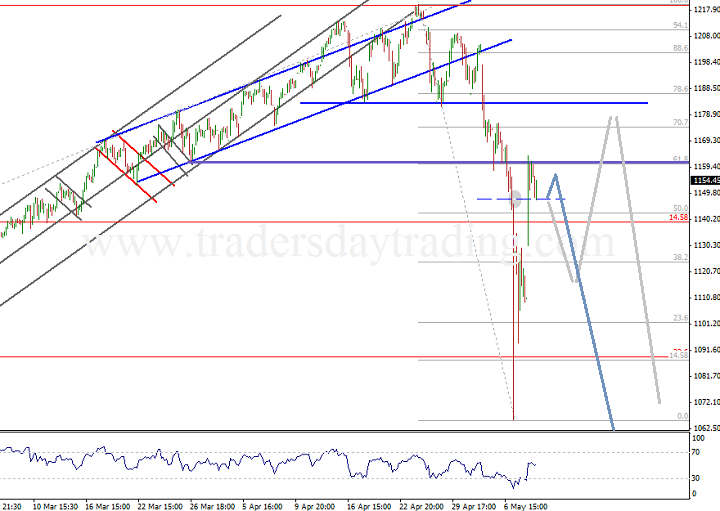
SP500 stock index - back testing completion of the head and shoulders! 10May2010
by Kenny
(tradersdaytrading.com)

Sp500 technical analysis chart - backtest
SP500 got stuck in no mans land today, its amazing how often those random lines seem to crop up as support and resistance zones.
You would think a move like that is bound to follow through and they gave themselves a real chance by holding that minor support level
Since we are counting this as a corrective bounce via the plan laid out on the Ftse100 speculative chart, we are laying odds that we either near enough completed the back test of the highs and will sort things out soon, or it is possible that we are just competing an 'a' of that backtest.
The first option will likely see an initially slow trickle, quickly turning into a flood.
Option 2 will most likely have a got at closing todays gap before another pop at the high.
We hope you have enjoyed browsing our website. If so, please sign our Guest Book and leave a comment!
Also, please be sure to sign up for our FREE newsletter!