A reverse, or Inverted
Head and Shoulders Pattern (often shortened to
IH&S)is a bullish
stock market technical
analysis charts reversal pattern that is found
at market
bottoms. A triple bottom is a variation of this.
Stock
chart patterns recognition
As a
variation of the Head and Shoulders pattern, the inverse Head and Shoulders
is also
one of the most reliable stock chart patterns found in technical
analysis charts,
but again it is important that volume
patterns confirm its
validity. There are some occasions when an Inverted Head and Shoulders
can be found as
part
of a continuation phase, but in these cases the pattern has usually not
been confirmed by volume.
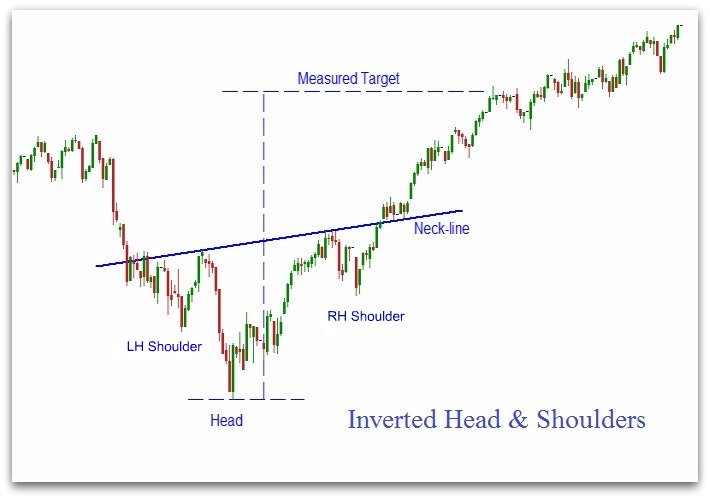
The
inverted left hand shoulder is created
by a consolidation
following a move produced with good volume levels.
Volume should decrease on the consolidation before sellers push the
market to new lows but with lower volume than the LH shoulder. This
creates the head as prices rise back to near the previous
consolidation level high.
The
right hand shoulder is then
formed on low volume when sellerss re-enter but fail to gain
momentum
producing a higher low and the markets then rise again on higher
volume. The neckline should be broken on high volume to confirm the
move.
Reverse Head and Shoulders Pattern -
Stock Chart Patterns
Backtest
Price
In a
normal market will usually drop back to backtest the validity of
the break up through the neckline of the Inverted Head and Shoulders. This move in prices should be on
much lower volume
but on rare occasions, it may not do a backtest if the markets momentum
is very
strong.
Volume Confirmation
LH Shoulder - high volume
Head -
declining volume
RH Shoulder - low volume
Neckline - must
be broken on high volume
Inverted Head and
Shoulders Targets
A
valid IH&S pattern produces a measured move so
we can
find
a price target by calculating the vertical height of the
Head, and
then measuring an equal distance above the neckline.
Stop Losses
A reverse head and
shoulders pattern fails and is not valid if prices
break back below the
level of the RH Shoulder before hitting its price target. Stop
losses can be placed just below this low.
Example of an Inverted Head and Shoulders
Chart Pattern
Head
and Shoulders Pattern
The bearish equivalent of an inverse H&S is the Head and Shoulders
pattern
(often shortened to H&S), it is a
bearish stock chart technical
analysis reversal pattern that is found
at
market tops.
A Free
10 part stock market beginners trading course. This trading course
offers an introduction to understanding how the financial markets work
and how to trade successfully.
What is spread betting (spread
trading)
and how does it work? Learn about the many advantages of
financial spread betting and find out where you can spread bet.
Learn how Elliott Wave analysis can improve your trading. Find out how
to access a Free 10 part tutorial for learning about the basics of
Elliott Wave analysis.