Top Forex PairsForex is the largest market in the world and trades around the clock. Which currency pair is trending the strongest RIGHT NOW? Find out what pair is topping our list and where is it going, view this list for free now! Todays Top Performing Forex Pairs
|
Testimonials
Great
site Kenny.
Technical
Analysis written in a straightforward way so that everyone understands.
There's
only a small few who get it consistantly correct and you are certainly
in
that group.
Chris
|
Thanks
for putting this all together and sharing! BHW
|
Awesome
Stuff! Kenny has shown time and time again the ability to show us direction in
these markets. Khalsa
|
Kenny, I appreciate your insight and analysis. You make sense of what I can rarely see.
Thanks for sharing. Gene
|
Took a gold short at 1240
just closed at 1203 :-)))))))))))))))))) ........ top call!! Gekko |
|
|
Online Forex Trading
Currency
Trading Explained Part 3
Forex Trading Explained Part 3
Forex
Trading - How Do
You Know When to Enter and Exit a Trade?
Previously,
we have discussed the forex market, how it operates and
determines foreign exchange values, what types of information move the
market, and the key factors for success for anyone contemplating
trading in the forex markets as a career or investment
pastime.
Now we will
cover the most important tool in a currency traders
toolbox, Technical Analysis, and how it will guide your entries and
exits in the Forex markets.
Information
related to money and risk management techniques will round
out this discussion regarding the crafting of an effective step-by-step
trading plan, a "must have" when dealing in this market.
Whether you
are day
trading in forex
or
extending your trades over a few days,
known as swing trading, the key to making profitable trades is tied to
knowing when to optimally enter and exit a position. The swiftness of
pricing movements can astound many newcomers to this market, leading to
quick losses if you are not careful.
Statistics
for the industry show that losing trades outnumber winning
trades 3 to 1.
The message
is clear, you must minimize your losses early, and let your
winners run for as long as you can.
You win
in forex
trading by
increasing your net
gains. Losses are a part of that equation.
Forex
Technical Analysis
Technical analysis
put quite simply is the study of previous price behavior of stocks,
commodities or currencies in order to forecast their pricing movements
in the future. The study typically uses charting and pattern
recognition, often derived from complex calculations and various
formulas. Computer software programs do all of the work
today.
The trader
must only interpret the signals and act
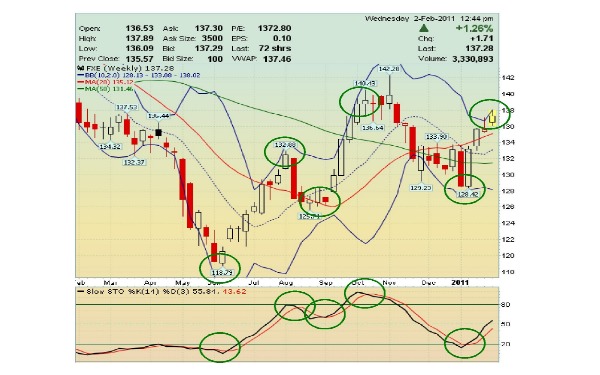
accordingly. Here is a chart that will illustrate the basics
of Forex
technical
analysis:
Forex Technical Analysis Explained
One great
benefit of technical
analysis is that it is flexible. The same
principles apply across investment types and also
timeframes. A day trader focused on forex scalping strategies
might
use similar, but different time period charts than a swing or position
trader looking for trends that might last days or weeks. The chart
above is for a longer-term currency
trading, but the same tools would work on hourly charts as
well.
In this
chart alone, valuable information can be gleaned from no less than four
common
technical analysis measures. Learning to interpret each is an
art form
in itself, but all give hints as to future prospects. Here is
the breakdown:
- Candlestick
Formations: The little red and transparent
“boxes” indicate high, low, opening and closing prices for the chosen
period. Pattern recognition is key, and centuries of research
have produced a number of signaling patterns;
- Moving
Averages: The red and green lines track moving
averages of 20 and 50 day periods.
Intersections often signal that changes are imminent;
- Bollinger
Bands: The blue border lines and dotted
centerline act like an 'accordion' to signal potential price ranges
over time;
- Slow
Stochastic Indicator:
Known as an oscillator, this indicator is favored by forex traders due
to its sensitivity to signal overbought and oversold
conditions. The green circles indicate signal points for
entering and exiting the market. If the last position
was closed, then the three trades would have produced a 32%
return.
Successful
Forex Trading
Prudent risk
management rules would have also set stop-loss orders below each entry
point to protect you from adverse pricing movements. Money
management rules would limit your position outlays to 2-3% on each
Forex trade, and never more than three times that amount at risk at any
one time.
Trading Forex is
high risk and complex, but hours of practice and a disciplined approach
to the market are keys for success.
Return to part 1 of Forex
Trading
|
|
|