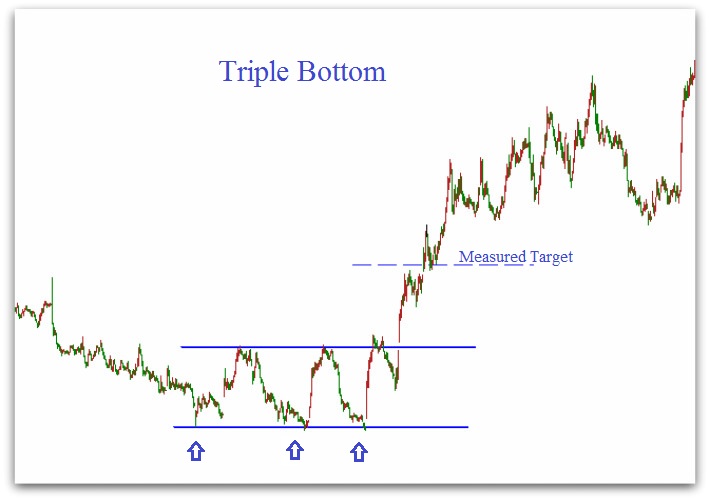
A Triple Bottom pattern
(TB) is a bullish
stock market
technical analysis charts reversal pattern that is found at market
bottoms.
Stock chart patterns recognition
A Triple Bottom
is one of the most reliable stock
chart
patterns found in technical analysis charts. It is a
straight forward
formation defined by three clear lows in the market at about the same
price levels. It is a variation of the inverted
head and shoulders pattern
except that the three lows all bottom around the same price
level in a
similar way to a double
bottom.
The first low is created when the prices rise in a consolidation
following a clear trending phase in the market. Prices then fall again
to a around the level of the first low but buyers fail to gain enough
momentum to push prices down through the support. The third low is
created in exactly the same way.
Prices can fall
slightly short or slightly exceed the previous lows but as long as the
all
bottom at around the same price level it is quite normal. Either way,
each low
should be on decreasing volume..
As prices rise again buyers gain control and volume increases.
The triple Bottom
is created when prices break up through the level of
the previous consolidation highs and this should be broken on high
volume.
Backtest
A normal market will usually fall back to backtest the validity of
the break up through resistance. This should be on much lower volume
but on rare occasions, it may not do a backtest if the market is very
strong.
Volume Confirmation
2nd low - decreasing volume
3rd low - decreasing volume
Subsequent rise - high volume
Break - high volume
Backtest - low volume
Targets
A valid triple bottom
pattern produces a measured move so we can
find a price target by calculating the vertical depth of the
consolidation zone, and
then measuring an equal distance above.
Stops
An triple bottom
fails and is not valid if prices break back below the
lows
before hitting its price target. If prices are accepted back down into
the bottoming zone once it has broken up through resistance, it
severely
weakens the odds that it is a valid TB pattern.
A Free
10 part stock market beginners trading course. This trading course
offers an introduction to understanding how the financial markets work
and how to trade successfully.
What is spread betting (spread
trading)
and how does it work? Learn about the many advantages of
financial spread betting and find out where you can spread bet.
Learn how Elliott Wave analysis can improve your trading. Find out how
to access a Free 10 part tutorial for learning about the basics of
Elliott Wave analysis.