The
Fibonacci Number Sequence - Trading with Elliott Wave
Elliott Wave and the Fibonacci
Sequence
|
Using The Fibonacci Number Sequence
in Elliott Wave Trading
The Number sequence Fibonacci
introduced, as
far back as the 13th Century has been found to have many uses in
technical analysis of the financial markets today. R.N Elliott himself described "The Fibonacci Summation Series
is the basis of The Wave Principle."
Elliot Wave trading involves using this sequence Fibonacci discovered
in a number of ways.
The
Fibonacci Sequence
The Fibonacci sequence is a series of
numbers that is formulated by adding the two previous numbers
together ie. (1+2)=3, (3+2)=5, (5+3)=8... etc
This
produces the sequence Fibonacci described in relation to the
mathematical problem he set out to solve relating to the breeding
patterns of Rabbits. He originally set out to estimate how
many
rabbits there would be in a year, originating from 1 pair in a field.
The conclusion he came to resulted in what we know today as the
Sequence of Fibonacci Numbers
The sequence Fibonacci numbers follow is
1, 2, 3, 5, 8, 13, 21, 34, 55, 89, 144, 233, 377....and so
on....
Applying
Elliott Wave Theory with the Fibonacci Sequence 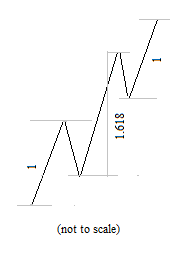
Fibonacci
ratios are derived from the sequence of Fibonacci numbers and
the
most important one is of course the Golden Ratio which is 0.618
The
Golden ratio appears in many forms throughout natural world and the
importance of the Fibonacci Ratios in stock chart analysis with Elliott
Wave is very clear to see.
There are many ways to
apply Fibonacci sequence studies to technical analysis and we also look
for
Fibonacci ratio relationships between the related waves in a cycle.
Here are some common ratios to look for in the length of related
waves....
.
- Wave 3 to wave 1 - 1,
1.618, 2.618, 4.236...
- Wave 5 to wave 1 - 0.5,
0.618, 1, 1.27, 1.382, 1.618...
When
one of the waves extends, there are some common relationships to look
for and an example of this can be seen in the chart opposite.
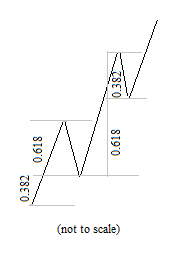
Common Fibonacci retrace ratios
Typical Fibbonacci sequence derived retracement ratios for
corrections are
- Wave 2 - 0.616, 0.786
- Wave 4 - 0.382, 0.5
- B waves - 0.5, 0.618, 1.00, 1.27,
1.382
Wave
2 is often sharp and deep. In an ideal world they would
retrace 0.618 or 0.786 most of the time.
Wave
4 tends toward being far shallower and will often find
support at the 0.382 level.
B
waves are generally less consistent and tend to vary in
length more but as a rule of thumb,Traders Day Trading generally looks
for a 0.5 retrace in a B
wave within a zigzag and either a 1.27 or 1.382 relationship in a
Flat corrective wave.
|
The Number Sequence Fibonacci Trading
with Elliott Wave Articles
|
|
Fibonacci
Techniques for Math Geeks -- and Everyone Else, Too
March 29, 2010
By Editorial Staff
The word Fibonacci (pronounced fib-oh-notch-ee)
can draw either blank stares or an enthusiastic response. There's
hardly any in-between ground. But for those who ask how an esoteric
mathematical relationship can apply to price charts and trading, here's
a quick lesson. Everyone who uses Elliott wave analysis will sooner or
later want to try using Fibo techniques, and Elliott Wave
International's Jeff Kennedy has written about five of them in a
Trader's Classroom column. For an example of why people are so
fascinated by Fibonacci, read part of Kennedy's article here:
* * * * *
How
to Apply Fibonacci Math to Real-World Trading
Have you ever given an expensive toy to a small child and watched while
the child had less fun playing with the toy than with the box that it
came in? In fact, I can remember some of the boxes I played with as a
child that became spaceships, time machines or vehicles to use on
dinosaur safaris.
In many ways,
Fibonacci math is just like the box kids enjoy playing with
imaginatively for hours on end. It's hard to imagine a wrong way to
apply Fibonacci ratios or multiples to financial markets, and new ways
are being tested every day. Let's look at just some of the ways I apply
Fibonacci math in my own analysis.
Fibonacci
Retracements
Financial markets demonstrate an uncanny propensity to reverse at
certain Fibonacci levels. The most common Fibonacci ratios I use to
forecast retracements are .382, .500 and .618. On occasion, I find .236
and .786 useful, but I prefer to stick with the big three. You can
imagine how helpful these can be: Knowing where a corrective move is
likely to end often identifies high-probability trade setups (Figures
7-1 and 7-2).


Kennedy then goes
on to explain Fibonacci
extensions, circles, fans and time, using
11 charts to show what he means. Whether or not you are a math geek,
you can learn a lot from this six-page introduction to Fibonacci math.
Get
Your Fibonacci
Techniques Right Here. Jeffrey
Kennedy has been using and teaching these techniques for years, and he
has written a quick description of five Fibonacci techniques in his
Trader's Classroom column -- now available to you for
freeby signing up as a Club EWI member. Read more about the
6-page report
here.
|
The Number Sequence Fibonacci Trading
with Elliott Wave
The Number sequence Fibonacci
introduced, as
far back as the 13th Century has been found to have many uses in
technical analysis of the financial markets today. R.N Elliott himself described "The Fibonacci Summation Series
is the basis of The Wave Principle."
Elliot Wave trading involves using this sequence Fibonacci discovered
in a number of ways.
Return
from - The
Number Sequence Fibonacci Trading with Elliott Wave to the Elliott Wave
Theory Homepage
|
|
|