Ftse100 Head and Shoulders Pattern 28Apr2010
by Kenny
(tradersdaytrading.com)

Ftse100 Head And Shoulders Pattern
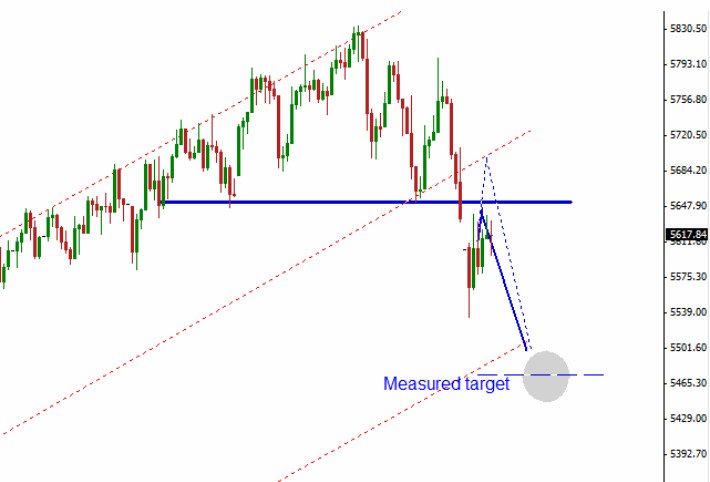
Today, the Ftse100 has broken down through the neckline of a possible Head and Shoulders Pattern.
It appears to be on decent volume so now has a very good chance of following through.
Conservative swing traders should now wait so see if prices backtest the break of the neckline to enable them to keep stop loss levels as tight as possible.
If the market is entering a very strong down phase then it is possible that we will not do a backtest, but these instances have lower odds. By far the most likely scenario is that we will see a backtest of some degree, and in a normal market, prices would get rejected at or near the neckline.
If after such a strong up phase, the market still has some strength to work out, it can take the route of the dotted line.
The key factor in that case would be that price does not get 'accepted' back above the neckline. If it were to, traders should take that as a clear warning signal that the head and shoulders pattern may yet fail.
If a trader were to enter a short trade position here, the stop loss would need to be set just above the right hand shoulder so for shorter term trades that is just too much to risk.
For a longer term trader it is less of a problem as they will adjust trade levels to factor in the risk involved according to how far away the stop levels are.
We already have our price target from the technique that we used in our section about Head and Shoulders Patterns in stock chart patterns recognition. so now lets see if it can do the business.
EDITED: 29Apr10...For Chester!
A zoom in on the updated
Ftse100 Head and Shoulders Pattern