The 3 Peaks and a Domed
House chart pattern is a little known bearish
reversal stock chart pattern that was discovered by stock
market analyst George Lindsay who issued a market advisory letter
through the 1950s to the 1970s. His forecasts identified
points in time where he believed a turn in the market was likely and
even indicated the magnitude of the ensuing moves.
Although there was also a booklet available, there is very little known
of George Lindsays work as he did not write
much about his
discoveries or publish his findings in a book, although some of his
work was later
published in an updated version of the Encyclopedia of Stock
Market
Techniques. Articles
by the Late George
Lindsay can still be obtained from
Investor Intelligence.
The 3 Peaks and a Domed
House Chart
Pattern
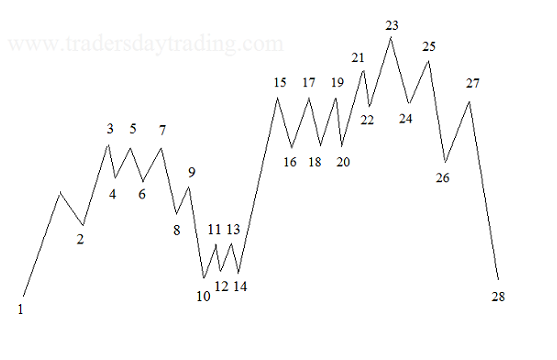
This is a graph of George Lindsays idealized Three Peaks and a Domed
House chart pattern which shows the basic shape
that the
pattern should
take, in real time trading it can have slight variations but the basic
shape and points must be as shown to become a valid pattern.
I have seen many analysts force this pattern on to a chart
with points
missing or out of proportion with the rest of the chart and invariably
the pattern 'fails' so as with all technical
analysis systems and chart
patterns, it is essential to follow what is actually there
and not force the pattern into a chart that it does not fit into.
The
Idealized Three Peaks and a Domed House Chart Pattern
The Three peaks and a
domed house pattern is so called because the first half of
the basic shape
takes the form of 3 Peaks
followed by a pattern that looks similar to
the shape of a domed house.
The Three Peaks Pattern
The Three Peaks part of the pattern is very straight forward where
points 1-2 form the base before a sharp rise to point 3, points 3-7
then form the three peaks pattern before a separating 3 wave decline
into point 10.
The Domed House Pattern
The secondary base within this stock
chart
pattern is created by an initial rise off the low at point 10 followed
by two corrective waves forming points 11-14 and this double correction
is an essential component of the domed house pattern.
The wall of the domed
house is created by a sharp rise into point 15
where the roof of the first story though to point 20. The second story
of the house is created by another sharp rise into point 21. The top or
the Dome part, takes the shape of a Head and Shoulders Pattern where
21 and 25 are the shoulders separated by a final burst of energy into
the Head at point 23.
The sharp declines into points 26 and 28 form the other side of the
walls.
The Three Peaks and a
Dome chart pattern gives us an incredibly
accurate price target for its completion as point 28 always returns to
withing a few points of the price level of point 10.
The Three Peaks and a Dome
Pattern - Time Frame
The idealized 3 peaks
and a dome chart pattern that
George
Lindsay identified was initially discovered on the daily
charts. He found
that the
Three Peaks part should take around 8 months to form, and the
Dome part of the pattern around 7 months.
Traders Day Trading
believes that if a chart pattern is a valid
entity within technical analysis then the same pattern must be valid on
all time frames. Chart patterns are a reflection of the sentiment of
mass participation by the markets as a whole, and as such it is logical
that as the markets participants travel through different
degrees of fear and greed throughout the cycles on the various time
frames, it must be that a valid chart pattern can occur at
any degree of time.
What we look for is that the pattern forms correctly with all points
are accounted for and that the pattern forms in proportion, in other
words it must have the right look about it as it forms to be considered
worth following.
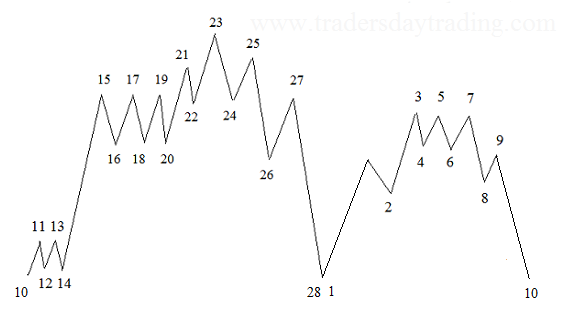
The Domed House and Three Peaks Chart
Pattern
George Lindsay also identified a very little known variation on his
original pattern where the Domed House pattern formed first
and was
then followed by the Three Peaks part.
Domed
House and 3 Peaks Chart Pattern
The
Domed House and 3 Peaks pattern forms identically to the 3 Peaks
and a Domed House chart pattern except it is the Dome part of the
pattern that forms first. You will observe here that points 28 and 1
are one in the same.
The price target in this variation of the pattern is that it is point
10 that returns to the level of point 28.
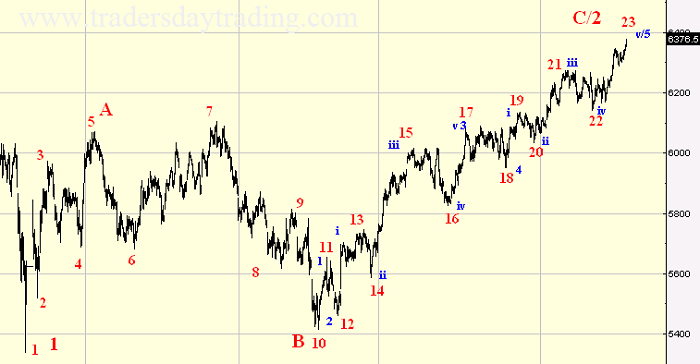
Examples of The 3 Peaks and a
Domed House Chart Pattern
Does the 3 Peaks and a
Dome pattern actually work and can
you actually use it for trading in real life?
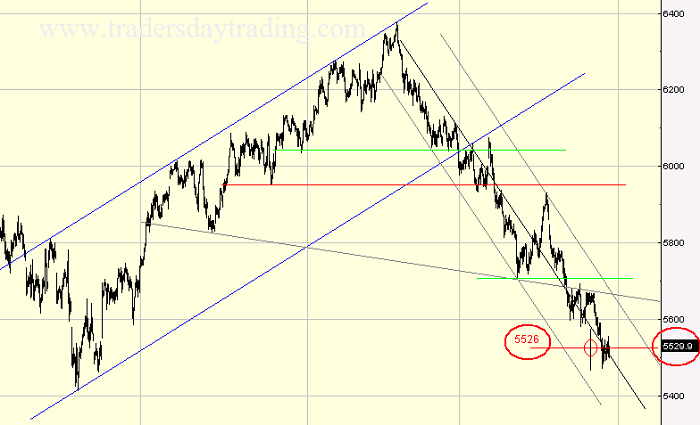
This is an extremely good real life example of the 3 Peaks and a
Domed House chart pattern that I recently posted live on
the
net as the pattern unfolded. These charts are of the Ftse100
from the period of January 2008 through to July 2008.
You may recall it as a period when the media and politicians were
labeling it as an 'unexpected' or 'unprecedented' time for
the markets
where nobody could have
known what was about to happen....
Example
of the Three Peaks and a Domed House - Ftse100 Jan2008 -
May2008
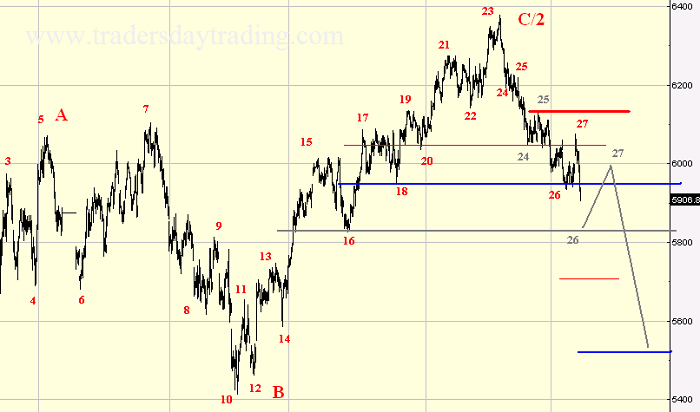
The following charts posted live at the time show the ensuing price
action and is a prime example of why I use technical analysis
instead
of
listening to the news for my trading and investment decisions.
Example
of the Three Peaks and a Domed House - Ftse100 Jan2008 -
Jun2008
Example
of the 3 Peaks and a Domed House - Ftse100 Jan2008 -
Jul2008
As you can see, this example of the 3 peaks and domed house
netted
nearly 1000 points on Ftse
100 over a month and a half so it is well
worth following these chart patterns when they form properly.
A Free
10 part stock market beginners trading course. This trading course
offers an introduction to understanding how the financial markets work
and how to trade successfully.
What is spread betting (spread
trading)
and how does it work? Learn about the many advantages of
financial spread betting and find out where you can spread bet.
Learn how Elliott Wave analysis can improve your trading. Find out how
to access a Free 10 part tutorial for learning about the basics of
Elliott Wave analysis.